

Planet
FOR A BEAUTIFUL PLANET
Carbon footprint
Houston, we have emissions
Our footprint
Together with our partner myclimate Germany gGmbH, we, like every year since 2019, measured our carbon footprint for FY 2024/25*. Over the years, we have expanded our emissions data set, leading to the numbers you’ll see here.
First: 99% of the reported FY 2024/25 GHG inventory is Scope 3, which are indirect emissions from our value chain, and totals 20,399 tonnes of CO₂-equivalent (CO₂e). So far, we have been in the process of measuring those emissions and capturing all the relevant emitters, so no reductions could be realised yet.
The remaining 1% is Scope 1 and 2: 148 of our total 20,547 tonnes CO₂e in FY 2024/25. These emissions were 61.5% lower than in the 2019 base year - calculated market-based, meaning we count the electricity we actually purchase, not the regional grid average. These emissions are a small share in the big picture, but they're the ones we could reduce directly and effectively: solar panels on our headquarters, and a company vehicle fleet that is becoming more and more electric.
*The Corporate Carbon Footprint was calculated together with myclimate Germany gGmbH in accordance with the GHG Protocol. Emission factors for materials were modelled by myclimate on the basis of currently available scientific data and cover more than 90% of our material volume; the remainder is not yet measured. All reductions stated are reductions in our own value chain. No carbon credits are included in the figures on this page.
Supply Chain Emissions
Scope 3
Regarding Scope 3*, one thing is very important: these figures are not comparable to last year's, because this year's 20,399 tonnes of CO₂e emissions cover more ground than last year's 16,178. We added trims such as zippers and buttons, plastic product packaging and the spinning process, and we have not restated the prior-year figure on the new basis, which is why the numbers are not comparable. The increase reflects a wider measurement boundary, not measured growth. Where primary data from deeper in the supply chain is missing, we calculate industry averages. In short: for now, measuring our Scope 3 is on the agenda, because you can’t reduce what you don’t measure.
* Our Scope 3 inventory includes emissions from: digital activities, commuting and business travel, transportation by third-party companies, food and beverages, water consumption, packaging and office supplies, the production and processing of textile fibres and trims, waste and recycling, as well as other emissions from electricity, heat and fuel consumption not allocated to Scope 1 or 2.
148 t
of CO2e emissions from own operations & energy use
20,399 t
of CO2e emissions from our value chain
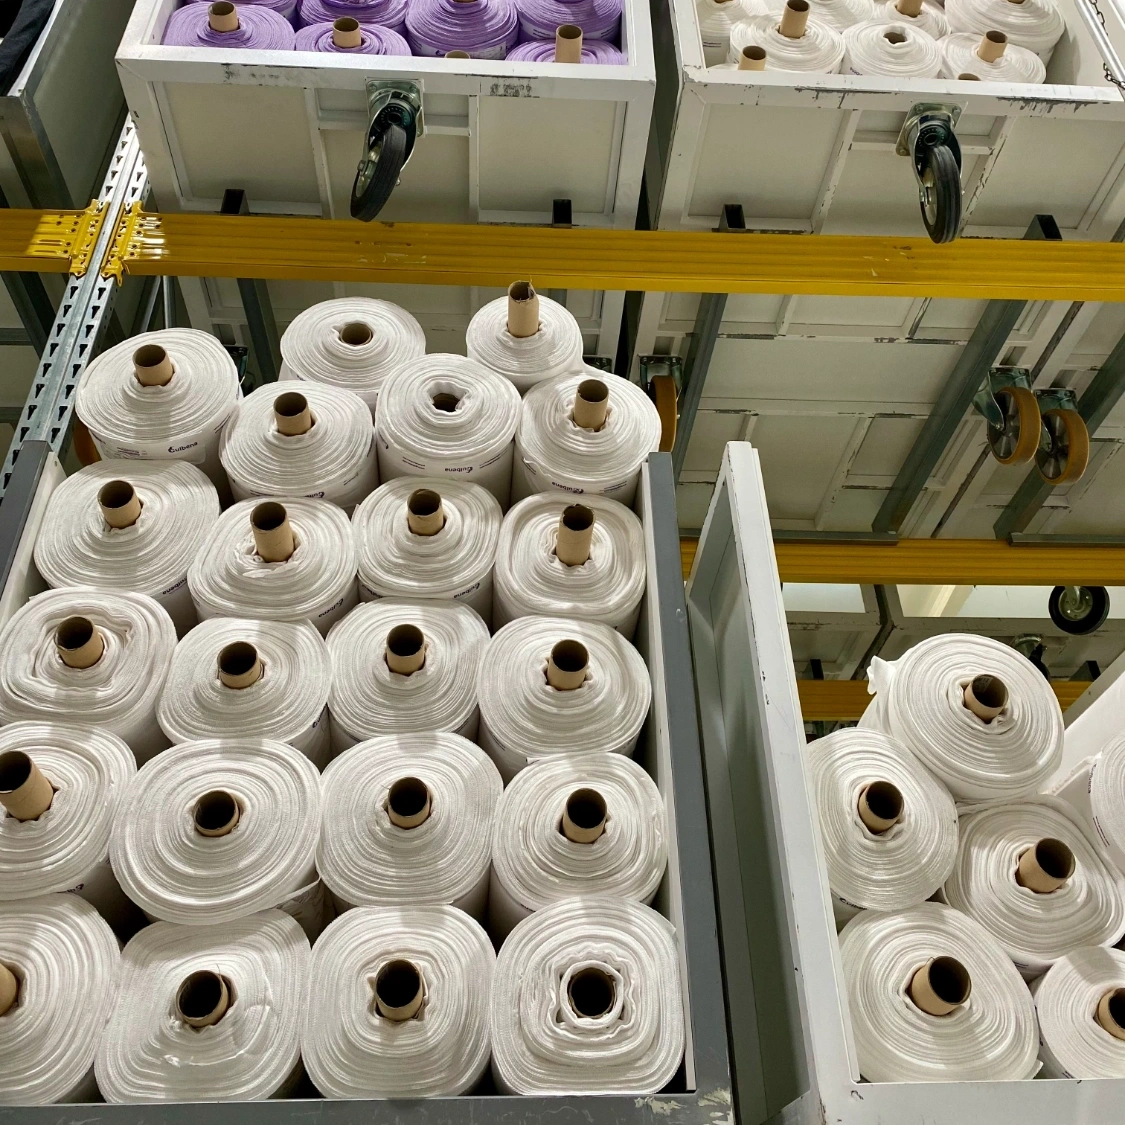
Gathering Scope 3 data
Our own electricity meter is easy to read. The one of a spinning mill on the other side of the planet is not. To still obtain some primary data from our supply chain, we take two routes:
- Supplier energy data: In 2025, we collected primary energy data from our five largest Tier 1 suppliers for the first time. These five produced finished garments accounting for 36% of our revenue in the 2024/25 seasons.
- Fabric supplier data collection: Additionally, we are surveying the most important fabric suppliers for our Cut-Make-Trim business model for primary energy data, including how much renewable energy they already use today and which options for switching to renewable energy are possible. We are not claiming a reduction outcome at this point.